用 R 语言绘图之放大曲线的一部分
楚新元 / 2023-10-01
这是《R 语言编程艺术》一书的一个经典案例,记录在此,方便查阅。
首先修改 curve() 函数,使其能返回 x 和 y 的取值。
crv = function (expr, from = NULL, to = NULL, n = 101, add = FALSE,
                type = "l", xname = "x", xlab = xname, ylab = NULL,
                log = NULL, xlim = NULL, ...)
{
  sexpr <- substitute(expr)
  if (is.name(sexpr)) {
    expr <- call(as.character(sexpr), as.name(xname))
  }
  else {
    if (!((is.call(sexpr) || is.expression(sexpr)) && xname %in%
          all.vars(sexpr)))
      stop(gettextf("'expr' must be a function, or a call or an expression containing '%s'",
                    xname), domain = NA)
    expr <- sexpr
  }
  if (dev.cur() == 1L && !isFALSE(add)) {
    warning("'add' will be ignored as there is no existing plot")
    add <- FALSE
  }
  addF <- isFALSE(add)
  if (is.null(ylab))
    ylab <- deparse(expr)
  if (is.null(from) || is.null(to)) {
    xl <- if (!is.null(xlim))
      xlim
    else if (!addF) {
      pu <- par("usr")[1L:2L]
      if (par("xaxs") == "r")
        pu <- extendrange(pu, f = -1/27)
      if (par("xlog"))
        10^pu
      else pu
    }
    else c(0, 1)
    if (is.null(from))
      from <- xl[1L]
    if (is.null(to))
      to <- xl[2L]
  }
  lg <- if (length(log))
    log
  else if (!addF && par("xlog"))
    "x"
  else ""
  if (length(lg) == 0)
    lg <- ""
  if (grepl("x", lg, fixed = TRUE)) {
    if (from <= 0 || to <= 0)
      stop("'from' and 'to' must be > 0 with log=\"x\"")
    x <- exp(seq.int(log(from), log(to), length.out = n))
  }
  else x <- seq.int(from, to, length.out = n)
  ll <- list(x = x)
  names(ll) <- xname
  y <- eval(expr, envir = ll, enclos = parent.frame())
  if (length(y) != length(x))
    stop("'expr' did not evaluate to an object of length 'n'")
  if (isTRUE(add))
    lines(x = x, y = y, type = type, ...)
  else plot(x = x, y = y, type = type,
            xlab = xlab, ylab = ylab,
            xlim = xlim, log = lg, ...)
  return(list(x = x, y = y))  # 这是唯一的一处修改
}
接下来自定义 inset() 函数:
# savexy:  list consisting of x and y vectors returned by crv()
# x1,y1,x2,y2:  coordinates of rectangular region to be magnified
# x3,y3,x4,y4:  coordinates of inset region
inset <- function(savexy, x1, y1, x2, y2, x3, y3, x4, y4) {
  rect(x1, y1, x2, y2)  # draw rectangle around region to be magnified
  rect(x3, y3, x4, y4)  # draw rectangle around the inset
  # get vectors of coordinates of previously plotted points
  savex <- savexy$x
  savey <- savexy$y
  # get subscripts of xi our range to be magnified
  n <- length(savex)
  xvalsinrange <- which(savex >= x1 & savex <= x2)
  yvalsforthosex <- savey[xvalsinrange]
  # check that our first box contains the entire curve for that X range
  if (any(yvalsforthosex < y1 | yvalsforthosex > y2)) {
    print("Y value outside first box")
    return()
  }
  # record some differences
  x2mnsx1 <- x2 - x1
  x4mnsx3 <- x4 - x3
  y2mnsy1 <- y2 - y1
  y4mnsy3 <- y4 - y3
  # for the i-th point in the original curve, the function plotpt() will
  # calculate the position of this point in the inset curve
  plotpt <- function(i) {
    newx <- x3 + ((savex[i] - x1) / x2mnsx1) * x4mnsx3
    newy <- y3 + ((savey[i] - y1) / y2mnsy1) * y4mnsy3
    return(c(newx, newy))
  }
  newxy <- sapply(xvalsinrange, plotpt)
  lines(newxy[1,], newxy[2,])
}
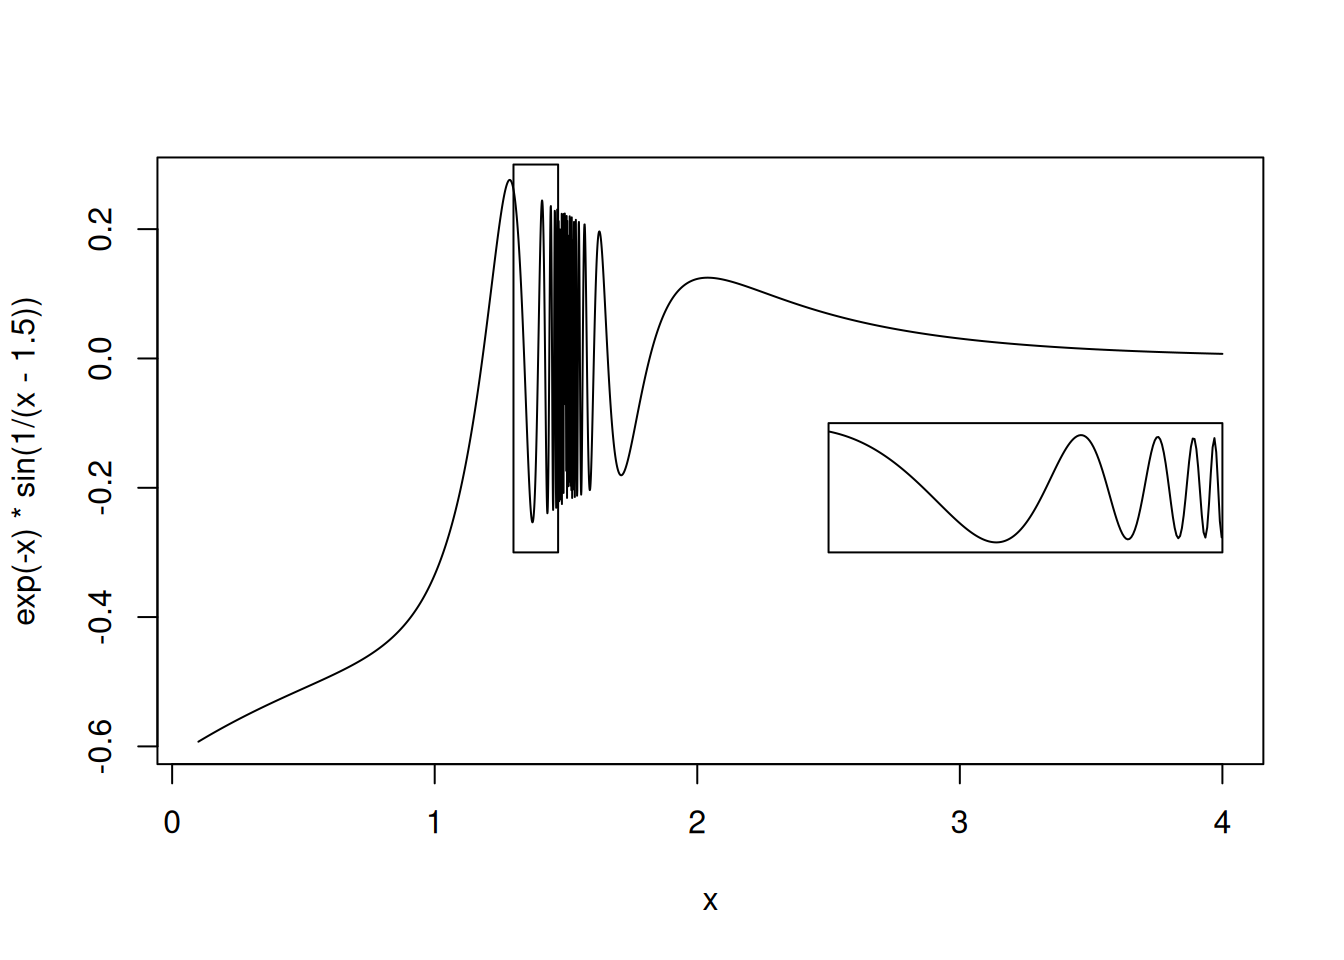
现在我们来测试以下它的效果:
xyout = crv(exp(-x) * sin(1 / (x - 1.5)), 0.1, 4, n = 5001)
inset(xyout, 1.3, -0.3, 1.47, 0.3, 2.5, -0.3, 4, -0.1)